ConclusionA. There were six degrees of of freedom used in this exercise
C. The calculated chi-square value was 40.06. D. Results did not indicate that chance alone caused unequal numbers of capture wooly worm phenotypes because the chi-square value was particularly high. E. The Shaggy phenotype was captured the least and thus was subjected to positive selection pressure. The Burt and Shrek phenotypes were subjected to negative selection pressure which meant they were captured the most. F. The phenotypes subjected to negative selection pressure, Burt and Shrek, will decrease in population over time. Meanwhile, those subjected to positive selection pressure will thrive and grow in population. G. Over a long period of time, the Shaggy worms would thrive and the Burt and Shrek worms would approach extinction. H. The bright green color of Burt and Shrek worms stood out on a dark brown background of dirt. Therefore, they were noticeable to birds and were consumed more so. I. If the environment remained the same over time, the populations with less bold and conspicuous colorings would survive and pass on the genes for those qualities that helped it survive. Therefore, in ten years, the bold colored worms would only remain in small populations, if at all.
0 Comments
Student Parking Lot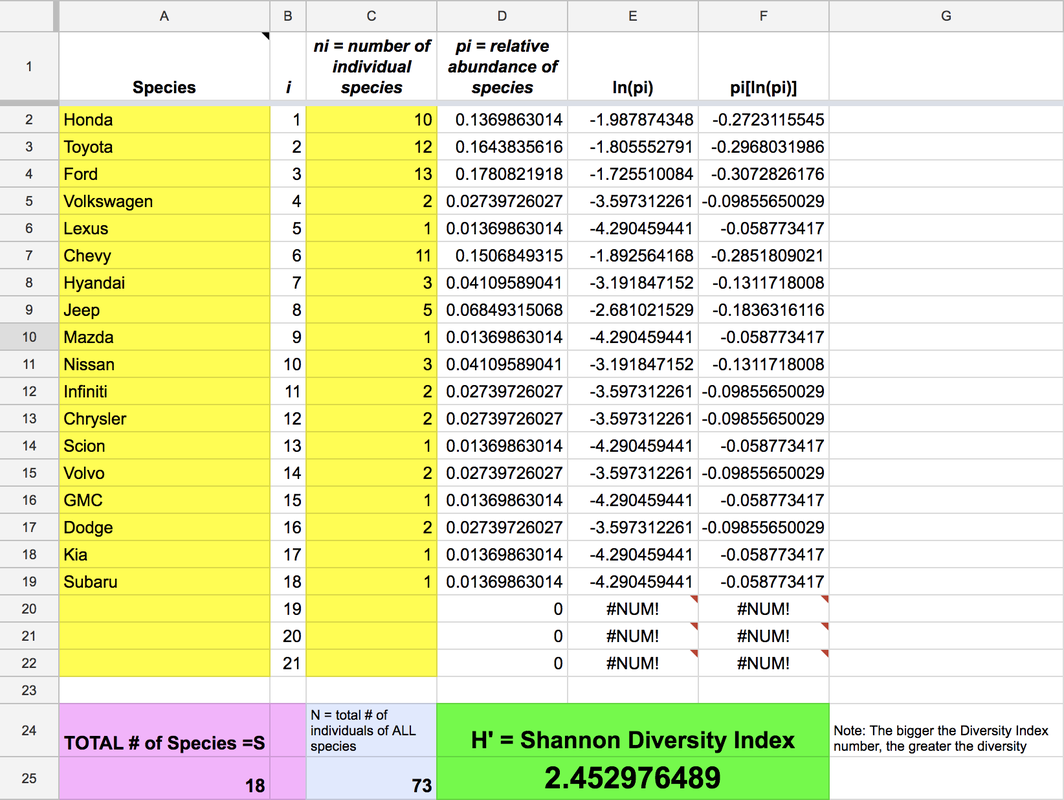 Teacher Parking Lot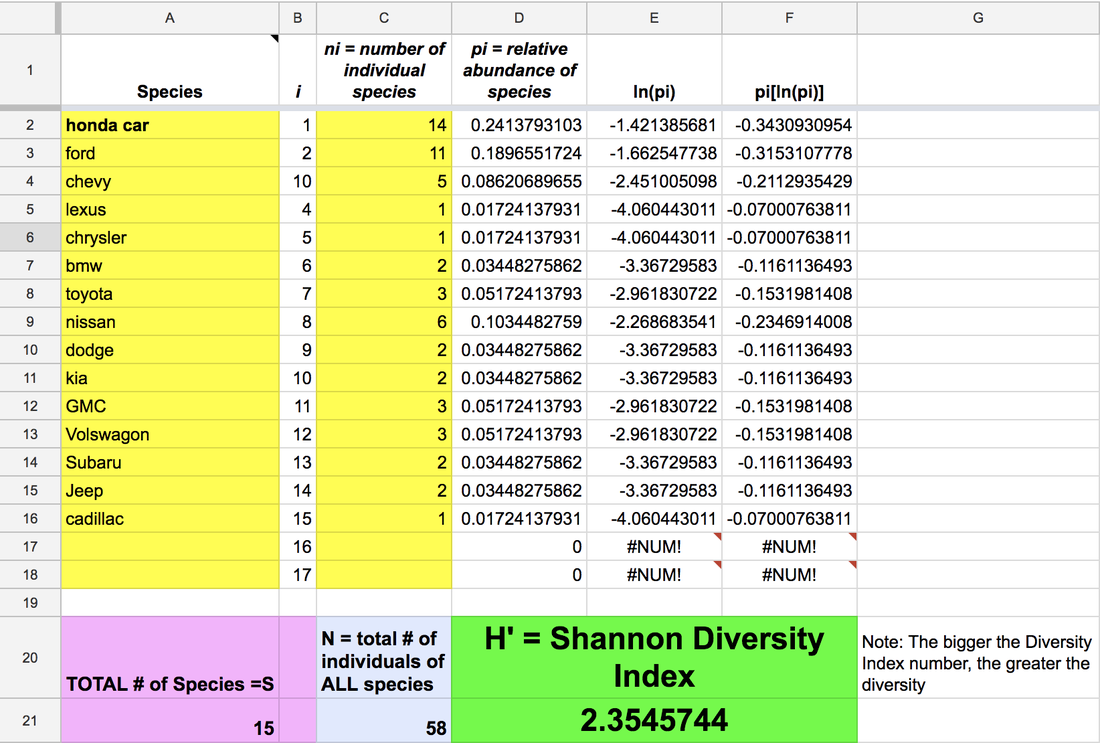 Postlab Questions1. Identify the parking lot that was most diverse. Based on your observations during the lab, explain why your prediction in question 1 of the pre-lab was supported or not supported.
The student parking lot was the most diverse in terms of car brands, which supports our prediction in question 1. 2. List the single most abundant species in each set of data, and write a plausible explanation to explain why these are the most abundant species. Fords were the most abundant in the student parking lot and Hondas were the most abundant in the teacher parking lot. Fords were likely abundant due to the fact that many trucks are Fords, and many students prefer trucks. Hondas, on the other hands, are usually SUVs and Sedans, which adults prefer. 3. Determine the maximum and minimum values for the Shannon Diversity Index in the parking lot you surveyed. The maximum value was 2.453 which was the Shannon Diversity Index in the student parking lot. The Shannon Diversity Index in the teacher parking lot was 2.355 which was the minimum value. 4. If you conducted this lab in a shopping mall parking lot, predict whether the Shannon Diversity Index would be high or low, and how would it compare to the school parking lots. The Shannon Diversity Index in a shopping mall parking lot would be higher because a diverse group of people shop there. With a wide variety of stores, the lifestyles and socioeconomic status of individuals there would be diverse which means the type of cars they would use would also be diverse. The Shannon Diversity Index would definitely be higher than in either school parking lot. 5. If you conducted this lab at a new car dealership, predict whether the Shannon Diversity Index would be high or low, and how would it compare to the school parking lots. Based on our statistics, the Shannon Diversity would be lower. The car dealership has only one brand of cars, while in a student parking lot there is a wide diversity of cars throughout the parking lot. Therefore, the Shannon Diversity Index would be lower. |
Archives
October 2017
Categories |
 RSS Feed
